 GeoData.NZ
Climatology, meteorology, atmosphere
Type of resources
Available actions
Topics
Keywords
Contact for the resource
Provided by
Years
Formats
Representation types
Update frequencies
status
-

We present 60 years of Δ14CO2 measurements from Wellington, New Zealand (41°S, 175°E). The record has been extended and fully revised. New measurements have been used to evaluate the existing record and to replace original measurements where warranted. This is the earliest atmospheric Δ14CO2 record and records the rise of the 14C “bomb spike”, the subsequent decline in Δ14CO2 as bomb 14C moved throughout the carbon cycle and increasing fossil fuel CO2 emissions further decreased atmospheric Δ14CO2. The initially large seasonal cycle in the 1960s reduces in amplitude and eventually reverses in phase, resulting in a small seasonal cycle of about 2 ‰ in the 2000s. The seasonal cycle at Wellington is dominated by the seasonality of cross-tropopause transport, and differs slightly from that at Cape Grim, Australia, which is influenced by anthropogenic sources in winter. Δ14CO2 at Cape Grim and Wellington show very similar trends, with significant differences only during periods of known measurement uncertainty. In contrast, Northern Hemisphere clean air sites show a higher and earlier bomb 14C peak, consistent with a 1.4-year interhemispheric exchange time. From the 1970s until the early 2000s, the Northern and Southern Hemisphere Δ14CO2 were quite similar, apparently due to the balance of 14C-free fossil fuel CO2 emissions in the north and 14C-depleted ocean upwelling in the south. The Southern Hemisphere sites show a consistent and marked elevation above the Northern Hemisphere sites since the early 2000s, which is most likely due to reduced upwelling of 14C-depleted and carbon-rich deep waters in the Southern Ocean. This developing Δ14CO2 interhemispheric gradient is consistent with recent studies that indicate a reinvigorated Southern Ocean carbon sink since the mid-2000s, and suggests that upwelling of deep waters plays an important role in this change. DOI: https://doi.org/10.5194/acp-17-14771-2017 Cite as: Turnbull, J. C., Mikaloff Fletcher, S. E., Ansell, I., Brailsford, G. W., Moss, R. C., Norris, M. W., and Steinkamp, K.: Sixty years of radiocarbon dioxide measurements at Wellington, New Zealand: 1954–2014, Atmos. Chem. Phys., 17, 14771–14784, https://doi.org/10.5194/acp-17-14771-2017, 2017.
-
Ultraviolet radiation measurements over the spectral region 290-450 nm with a high precision spectro-radiometer. The spectro-radiometer was installed at Arrival Heights as a two month (November 2006 – January 2007) blind inter-comparison with the established measurement programme run by Biospherical Instruments for the USAP. The data was compared with the USAP data taken simultaneously. These data are held internally by NIWA. GET DATA: contact dan.smale@niwa.co.nz
-
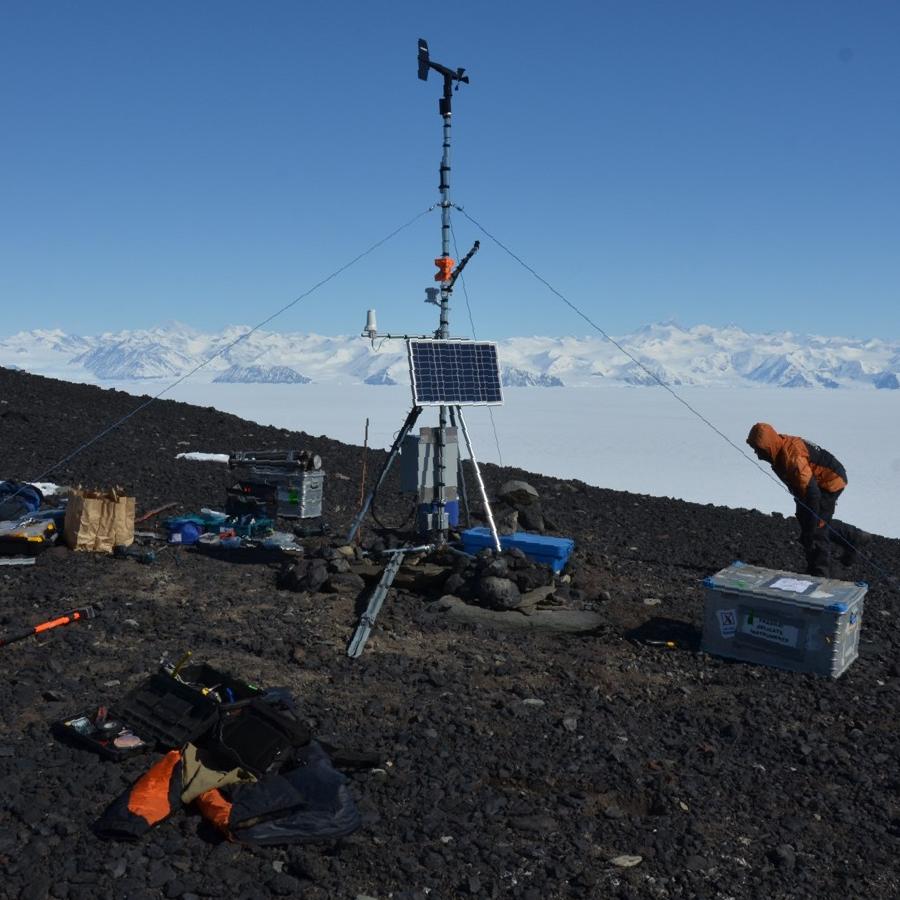
An automated weather station operates at Cape Adare (-71.30492, 170.23256). The station was established in 2014 and continues to transmit live data. Data are logged every 30 minutes. Parameters: - Air Temperature (C) - Relative Humidity (%) - Solar Radiation (W/m2) - PAR (uE) - Wind Speed (m/s) - Wind Gust (m/s) - Wind Direction (true bearing degrees) GET DATA: adminteam@antarcticanz.govt.nz
-
Measurements of chlorine monoxide (ClO) made with a Microwave Chlorine Monoxide Millimeter Wave Spectrometer (ground-based). The instrument (ClOe1) was established in January of 1996 at Scott Base and decommissioned in October 2023. A replacement radiometer (ClOe4) was installed at Scott Base in February 2023 (an overlap in the data for timeseries continuity purposes). These data are produced in collaboration with State University of New York (SUNY) Stoney Brook and Naval Research Laboratory (NRL). “Raw” data are times and recorded microwave emission spectra. “Derived” data are column amounts and vertical profile information of chlorine monoxide (ClO). The instrument has acquired the nickname "CloeTechnique" for vertical profile information uses "optimal estimation" to extract information from pressure broadening of ClO emission line. Significant failure in early 2018 only fixed in November 2018. No data in the July - October 2018 period. Data is held at NRL and in the NDACC database. Data are available as monthly .ndm files, and additional metadata are available in the header. Instrument timeline: - ClOe1 1996-2023 - ClOe4 2023 – present GET DATA: https://www-air.larc.nasa.gov/missions/ndacc/data.html?station=scott.base#
-
AntAir ICE is an air temperature dataset for terrestrial Antarctica, the ice shelves, and the seasonal sea ice around Antarctica in a 1km2 spatial grid resolution and a daily temporal resolution available from 2003-2021. AntAir ICE was produced by modelling air temperature from MODIS ice surface temperature and land surface temperature using linear models. In-situ measurements of air temperature from 117 Automatic Weather Stations were used as the response variable. Each day has a bricked spatial raster with two layers, saved as a GeoTIFF format and in the Antarctic Polar Stereographic projection (EPSG 3031). The first layer is the predicted near surface air temperature for that day in degree Celsius * 10 and the second layer is the number of available MODIS scenes for that day ranging from 0 to 4. Areas with cloud contamination or without sea ice are marked with no data. Files for each year (2003-2021) are compressed with a ZIP files for each quarter. Python 3.8 was used for conversion of the MODIS products from HDF files to raster and all data handling and processing was thereafter done in R version 4.0.0. All data processing and modelling procedures are available as R scripts on a public Github repository: https://github.com/evabendix/AntAir-ICE. Using this code it is possible to download new available MODIS LST and IST scenes and apply the model to continue the near-surface air temperature dataset. Related Publication: https://doi.org/10.1038/s41597-023-02720-z GET DATA: https://doi.org/10.1594/PANGAEA.954750
-
The WWLLN Very Low Frequency (VLF) Radio Sensor was installed at Scott Base in November 2015 by Dr. James Brundell and Ms. Emma Douma as part of Antarctica New Zealand Event K060-1516-A. The sensor measures the electric field in the Very Low Frequency radio range (~500 Hz-50 kHz) and passes it to a PC which processes the data for the experiments. The antenna is located behind the Hatherton lab. It was installed due to increasing manmade electromagnetic noise levels in the "quiet zone" at Arrival Heights. The observations from this antenna are now the primary WWLLN feed from Ross Island, the Arrival Height's magnetic field antenna is now a backup. WWLLN, uses the VLF feed but processes it to detect the radio-wave pulses from lightning. WWLLN observations are sent to a central processing computer to determine the time and location of lightning pulses all over the globe. The World Wide Lightning Location Network (WWLLN) is an experimental Very Low Frequency (VLF) network of sensors being developed through collaborations with research institutions across the globe. The network exploits the considerable electromagnetic power radiated by lightning as "sferics" present in the VLF band. By combining radio-pulse observations from at least 5 stations, the WWLLN central processing computers can determine the location of the original lightning discharge. As the radio-pulse observations are immediately sent back across the internet to the central processing computers locations are generated within ~10 s of the discharge, and thus near real time. There are currently about 70 active VLF receiving stations operating in the VLF World-Wide Lightning Location Network, including the Scott Base measurements. WWLLN observations are continuously transmitted to one of the WWLLN primary servers, in this case flash.ess.washington.edu at the University of Washington, Seattle, USA. GET DATA: https://space.physics.otago.ac.nz/aarddvark/
-
Measurements of total column of ozone made with Dobson spectrophotometer that measures either direct or zenith scattered ultraviolet light. The instrument was established in September of 1989 at 77° 49.8'S, 166° 39.6'E. Additionally a Brewer spectrophotometer took total column ozone measurements at Scott from 1989 to 1996. From 1989 to 2006 the Dobson (ID 17) was operated in manual mode but had an electronic encoder and computer added in 2006 for recording measurements. The data acquisition system was upgraded in Febuerary 2015 at Lauder, NZ. It is now running the JMA automation system. The Dobson (instrument ID: D17) is shipped out for maintenance and intercomparison with regional standard Dobson in Melbourne approximately every 5 years. Data (for both Dobson and Brewer) is held internally by NIWA and in the NDACC database. Data is also archived in the ozone and UV data centre Toronto, “Raw” data are times and instrument settings for instrument readings. “Derived” data are column amounts of ozone. Time line: Dobson 1987 -present Brewer 1989-1996 GET DATA: https://www-air.larc.nasa.gov/missions/ndacc/data.html?station=arrival.heights#
-
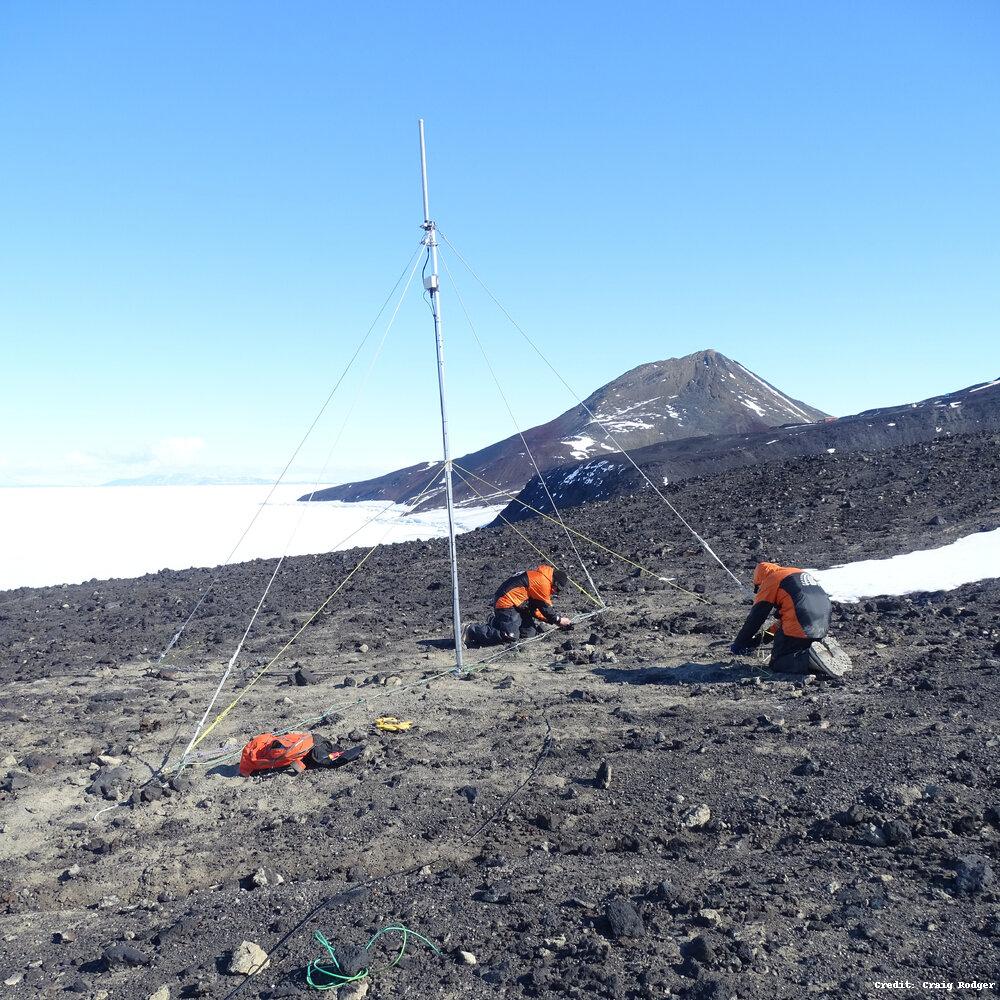
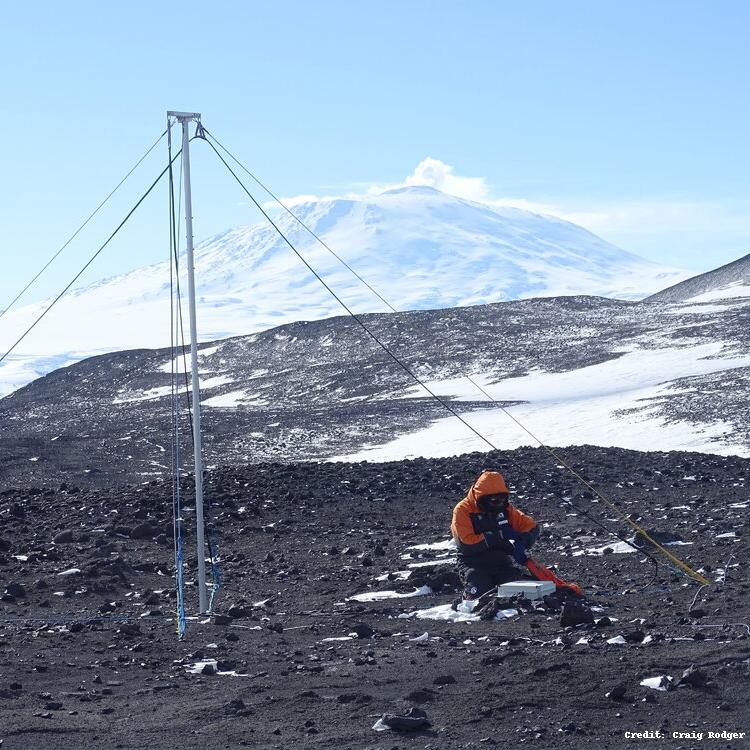
The AARDDVARK/WWLLN Very Low Frequency (VLF) Radio Sensor was installed at Arrival Heights from 10-15 December 2008 by Dr Craig J. Rodger and Dr. James Brundell as part of Antarctica New Zealand Event K069a. The sensor measures the magnetic field in the Very Low Frequency radio range (~500 Hz-50 kHz), and passes it to a PC which processes the data for the experiments. The primary experiment is the AARDDVARK observations. The secondary experiment, WWLLN, uses exactly the same VLF feed but processes it to detect the radio-wave pulses from lightning. WWLLN observations are sent to a central processing computer to determine the time and location of lightning pulses all over the globe. The World Wide Lightning Location Network (WWLLN) is an experimental Very Low Frequency (VLF) network of sensors being developed through collaborations with research institutions across the globe. The network exploits the considerable electromagnetic power radiated by lightning as "sferics" present in the VLF band. By combining radio-pulse observations from at least 5 stations, the WWLLN central processing computers can determine the location of the original lightning discharge. As the radio-pulse observations are immediately sent back across the internet to the central processing computers locations are generated within ~10 s of the discharge, and thus near real time. There are currently about 70 active VLF receiving stations operating in the VLF World-Wide Lightning Location Network, including the "Scott Base" measurements made at Arrival Heights or near the Hatherton Lab (depending on noise levels). WWLLN observations are continuously transmitted to one of the WWLLN primary servers, in this case flash.ess.washington.edu at the University of Washington, Seattle, USA. Two near-orthogonal magnetic field loops measuring VLF electromagnetic waves. The centre of the antenna is at 77° 49.790' S, 166° 39.438' E, based on a GPS measurement with 1 m accuracy. Logging is undertaken with standard WWLLN software, with GPS timing. GET DATA: https://wwlln.net/
-
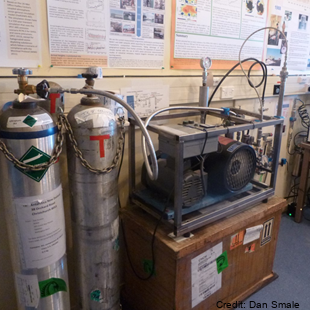
Gas samples (CO2, CH4, CO, N2O, 13CO2, 14CH4, 13CO, C18O, 14CO) are collected from an inlet atop of a mast 5 metres above ground level in North sector wind conditions. Flasks and cylinders are analysed back at NIWA Greta point Gaslab. The sampling was established in November 1989. Samples are only taken when wind is from the Northerly sector and above 5kts. High pressure cylinders: ~1600psi in 30 litre cylinders and low-pressure flask samples taken (~5 litres, 25 psi in 2 litre flask). Air samples in the Cylinders & Flasks shipped to New Zealand regularly. Analysis performed at NIWA's GASLAB located at Greta Point Wellington. Analysis by Gas chromatography (GC) and isotope ratio mass spectrometry (IRMS). A semi-automated flask sampling system was installed in February 2017, allowing extra flask samples with minimal operator intervention. GET DATA: Contact Gordon Brailsford (g.brailsford@niwa.co.nz)
-
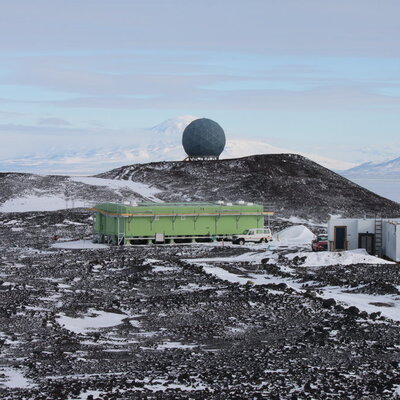
Our studies investigate the Antarctic middle atmosphere’s response to natural and man-made factors which change climate. The dynamical processes of this region are significant in controlling the circulation at lower altitudes, including the stratospheric ozone layer. The feedbacks in the atmosphere, couple this change to climate change at the surface. The seasonal behaviour of this wave-driven circulation, particularly its dependence on major disturbances in the stratosphere which result in the transport of energy and momentum by waves to higher altitudes are examined. The programme is based on continuous monitoring of winds in the middle atmosphere at altitudes of 60-100km using a ground-based medium frequency radar located at Scott Base. The Scott Base radar has been recording wind measurements since 1982 and is one of the longest duration climate records of this type of data in the world. The measurements made by the Scott Base MF radar provide valuable climate information about how the flow in the middle atmosphere (70-100 km) has changed. This record along with observations from satellite instruments allows the coupling between the middle atmosphere and the surface over Antarctica to be examined, this coupling is often associated with wave-like motions in the atmosphere that the MF radar is particularly good at observing. The circulation is dominated by pole-to-pole flow, from the summer pole to the winter pole. This circulation is largely driven by atmospheric waves with time scales from 15 minutes to 15 days. The large scale of the phenomenon benefits considerably from co-operative observations by our own radar near Christchurch, and by our US colleagues at the South Pole, Admiral Heights (from January 2000) and Tekapo. We also use satellite data for the region between Antarctica and New Zealand. This type of study is important because improvements in the predictive ability of the current generation of climate models may be particularly sensitive to the coupling processes that we examine.